Data Discovery: Execution History and Events
Execution
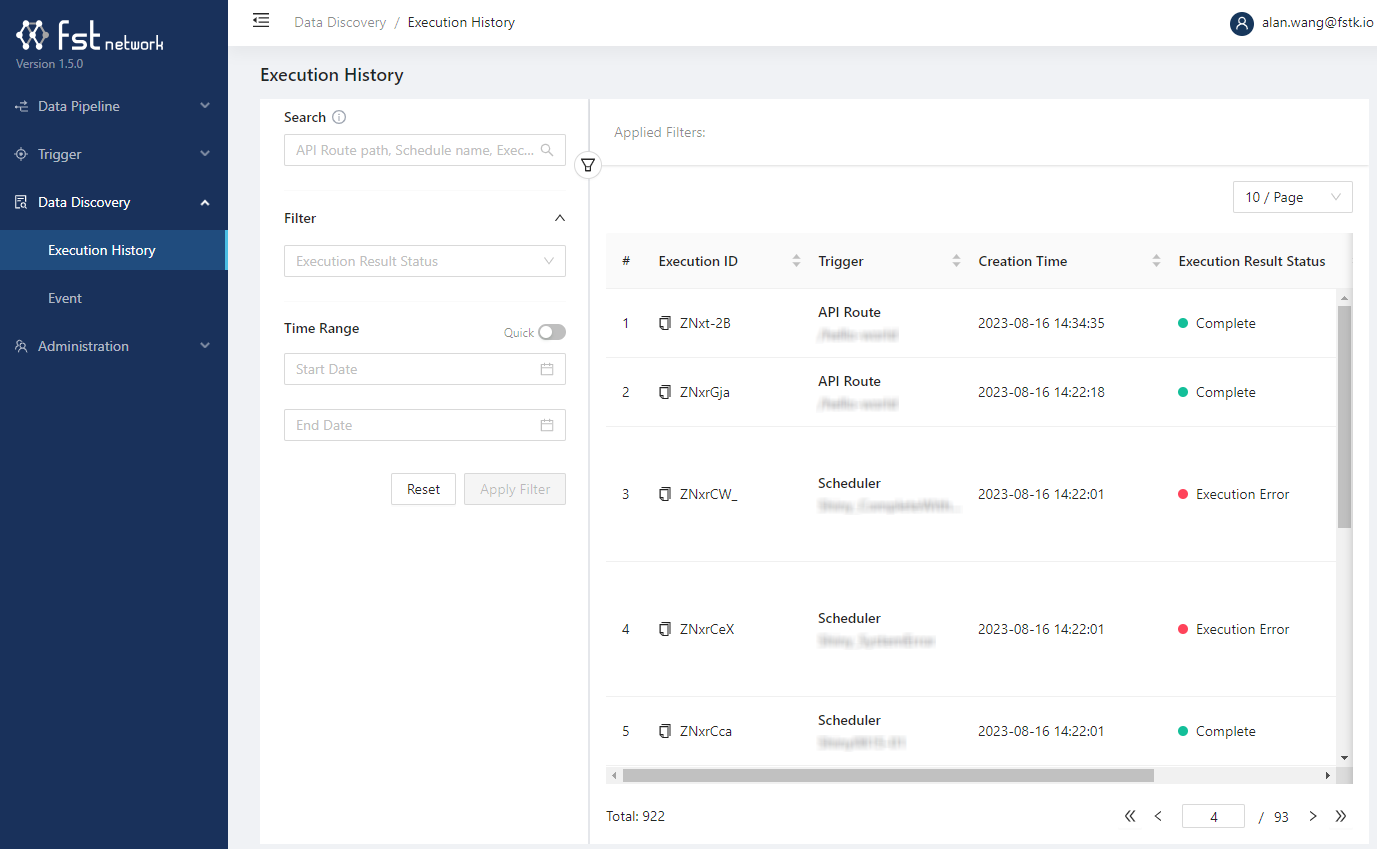
For browsing and filtering execution histories, each record represents one execution from one trigger which contains at least one tasks. Each task contains logs (from Logging Agent), trigger payload as well as task result (from Result Agent) from each task.
Click the trigger name to inspect the details, from which you can expand the list of logic and their logs.

See View Execution History in one of the tutorial for more details.
Execution Status
● Complete | An execution, task or logic had completed execution without errors or timeout. |
● In Progress | An execution is still running due to execution of one of the task or logic has not yet completed and timeout hasn't been reached. |
● Timeout | Execution time of one of the task had exceeded the data process' timeout limit (default: 180 seconds). |
● Execution Error | For an execution, it indicates one of the task had reported
|
● Complete with Error |
|
● System Error |
|
● Not Execute | Logic had skipped execution due to one previous logic in the task
had reported |
Event
For browsing and filtering events (emitted by Event Store Agent).
Each event - a persistent "log" with metadata including label name, source DID, target DID, meta payload and time/task-related fields - can be queried for various purposes.
See the following tutorials of how to emit and inspect events/data lineages:
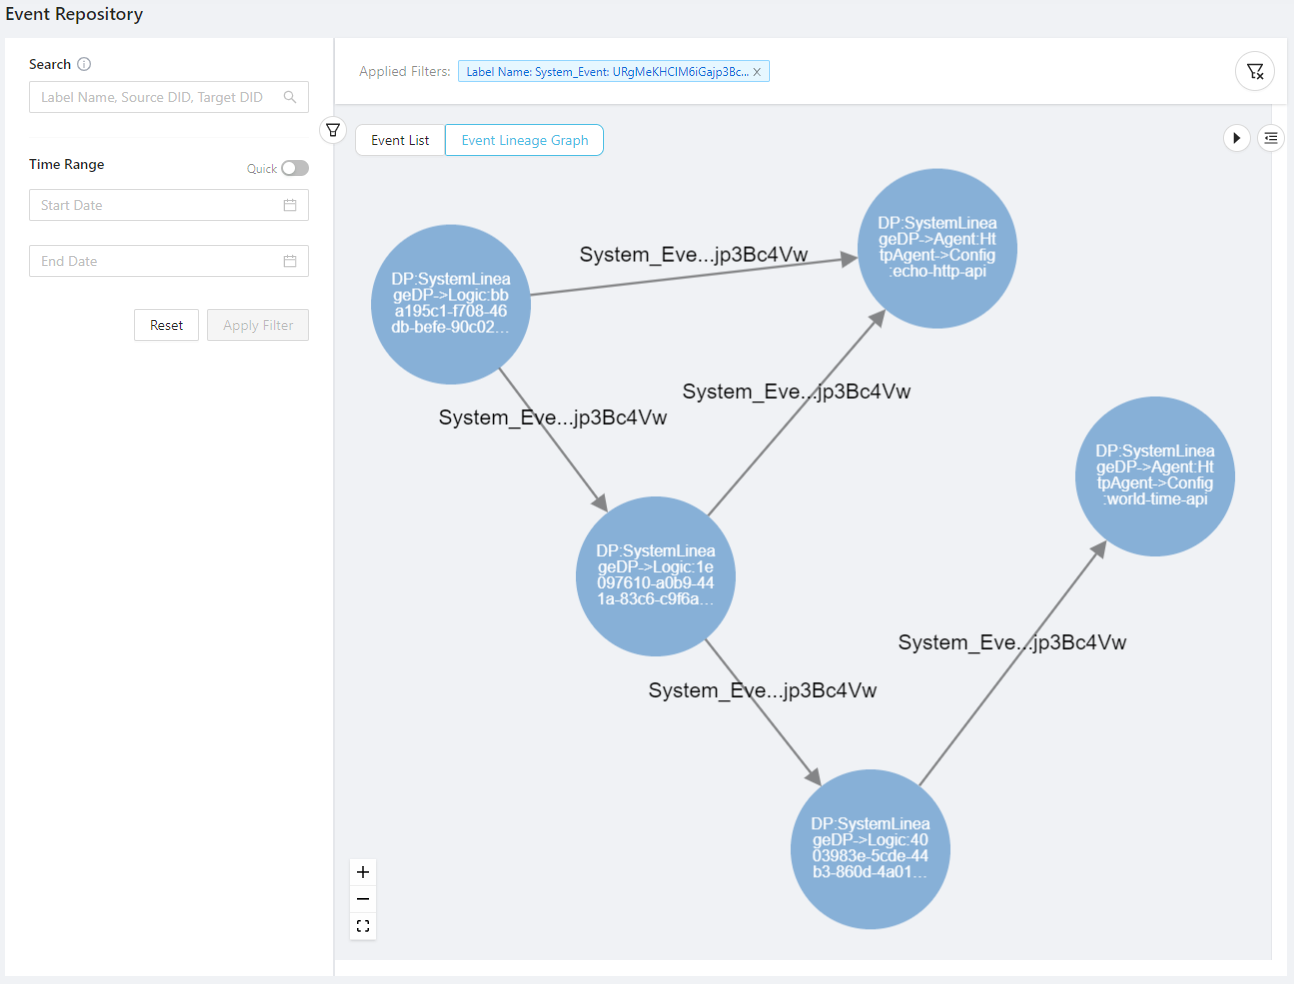
Event Lineage Graph
After filtering events, you can click Event Lineage Graph to inspect the graphical result of data lineage:

If you click an event by its label name or source/target DID, you will be switched to the Label Name or DID panels.