Events and Multiple Data Processes
- To query events emitted from another data process.
- To inspect the larger data lineage consist of multiple types of events.
This is the follow-up of Emit and Inspect Events, in which we've learned the basics of emitting events.
In reality, your company may have much longer business processes, and they may lay across several different departments. LOC events play an important role of communicate between data processes, as well as to track how data flows.
For example, now that we have some policy applications coming in, we need to assign them to insurance agents. We will, of course, build a second data process to achieve this.
How to trigger the second data process depends on your use case, but generally you can
- Have the second data process run on scheduler and check events periodically;
- Have the first data process invoke a API route or message queue trigger;
- Manually started by human operators.
In this example we will execute it manually.
Query Events
Use Case: Assigning Insurance Agent
This new data process will query the EventPolicyRequest events emitted in the previous tutorial, extract the request ID and policy code, then assign to the agent who is responsible for a specific type of policy:
We will use a mock-up agent mapping table (instead of querying it from some databases):
| Agent name | Responsible for |
|---|---|
| Marvin | P100, P200 |
| Trillian | P300, P400, P500 |
So if the requested insurance policy is type P100, it will be assigned to Marvin, and so on.
Code Walkthrough
This time we'll create the second data process Policy Assign:
| Logic | Name | Purpose |
|---|---|---|
| Generic logic #1 | Policy Query Logic | Query EventPolicyRequest events and write into session |
| Generic logic #2 | Policy Assign Logic | Read from session and emit EventAssignAgent events |
| Aggregator logic | Result Aggregator (source) | Finalise task result |
We don't need Payload JSON Parser this time since this data process does not require trigger payload. Instead, policy-query will query the events we are looking for and write them into the parsed session variable.
- Policy Query Logic (Generic #1)
- Policy Assign Logic (Generic #2)
import {
    LoggingAgent,
    SessionStorageAgent,
    EventAgent,
} from "@fstnetwork/loc-logic-sdk";

export async function run(ctx) {
    // event query conditions
    const requests = {
        queries: [
            {
                field: "label_name", // field name
                type: "match", // matching operator
                value: "EventPolicyRequest", // value (event name)
            },
        ],
        excludes: [],
        filters: [],
        from: 0,
        size: 1000,
        sorts: [],
    };

    // query events
    const query = await EventAgent.search(requests);
    const events = query?.events;

    if (events) {
        // log queried events
        LoggingAgent.info({ queried_events: query?.events });

        // overwrite parsed with events if not empty
        await SessionStorageAgent.putJson("parsed", query?.events);
    }
}

export async function handleError(ctx, error) {
    // error logging
    LoggingAgent.error({
        error: true,
        errorMessage: error.message,
        stack: error.stack,
        taskId: ctx.task.taskKey,
    });
}
import {
    LoggingAgent,
    SessionStorageAgent,
    EventAgent,
} from "@fstnetwork/loc-logic-sdk";

export async function run(ctx) {
    // read parsed from session
    const parsed = await SessionStorageAgent.get("parsed");

    // check if parsed is an array
    if (!Array.isArray(parsed)) return;

    // use the queried events to generate new event schemas
    let events = [];
    parsed.forEach((event) => {
        const policyCode = event?.meta;
        const requestID = event?.targetDigitalIdentity;

        if (requestID && policyCode) {
            const agent = search_agent(policyCode);

            if (agent) {
                // if an agent is found
                events.push({
                    labelName: "EventAssignAgent",
                    sourceDID: requestID,
                    targetDID: agent,
                    meta: policyCode,
                    type: "default",
                });
            }
        }
    });

    // emit events
    await EventAgent.emit(events);

    // prepare result
    const result = {
        emitted_length: events.length,
        events: events,
    };

    // log events
    LoggingAgent.info(result);

    // write events to result
    await SessionStorageAgent.putJson("result", result);
}

export async function handleError(ctx, error) {
    // error logging
    LoggingAgent.error({
        error: true,
        errorMessage: error.message,
        stack: error.stack,
        taskId: ctx.task.taskKey,
    });
}

// a mock-up lookup table of agents and their responsible policy types
const insurance_agents = {
    Marvin: ["P200", "P300"],
    Trillian: ["P100", "P400", "P500"],
};

// agent name lookup helper
const search_agent = (policyCode) => {
    for (let agent in insurance_agents)
        for (let responsibility of insurance_agents[agent])
            if (responsibility === policyCode) return agent;
    return null;
};
Filter events within a timespan
By the example above the event store agent would query as many as 1,000 events. It would be sensible to do some double-checking so that you won't process the same event twice. You can also filter events within s certain timespan:
...
const requests = {
    queries: [
        {
            field: "label_name",
            type: "match",
            value: "EventPolicyRequest"
        }
    ],
    excludes: [],
    filters: [  // add a filter condition
        {
            field: "timestamp",
            gte: Date.now() - 10 * 60 * 1000,  // greater than or equal
            lte: Date.now(),  // less than or equal
            type: "range",
        }
    ],
    from: 0,
    size: 1000,
    sorts: [],
    };

    ...
Both gte and lte fields receive a number (unix timestamp).
The query parameters above would try to find events with label name EventPolicyRequest emitted within 10 minutes.
Invoke Data Process
This data process does not need any payload. You can execute it with manual trigger or an API route without adding any payload.
After executing the data process, tt should return a similar result as the first policy allication data process:
{
    "status": "ok",
    "taskKey": {
        "executionId": "ZOMn3_2atIqBa1xcELqoYw",
        "taskId": "MgSowyszCqBNB2uPW33Lsg"
    },
    "data": {
        "emitted_length": 3,
        "events": [
            {
                "labelName": "EventAssignAgent",
                "sourceDID": "R0042",
                "targetDID": "Trillian",
                "meta": "P100",
                "type": "default"
            },
            {
                "labelName": "EventAssignAgent",
                "sourceDID": "R0043",
                "targetDID": "Marvin",
                "meta": "P300",
                "type": "default"
            },
            {
                "labelName": "EventAssignAgent",
                "sourceDID": "R0044",
                "targetDID": "Trillian",
                "meta": "P500",
                "type": "default"
            }
        ]
    }
}
Inspect Events
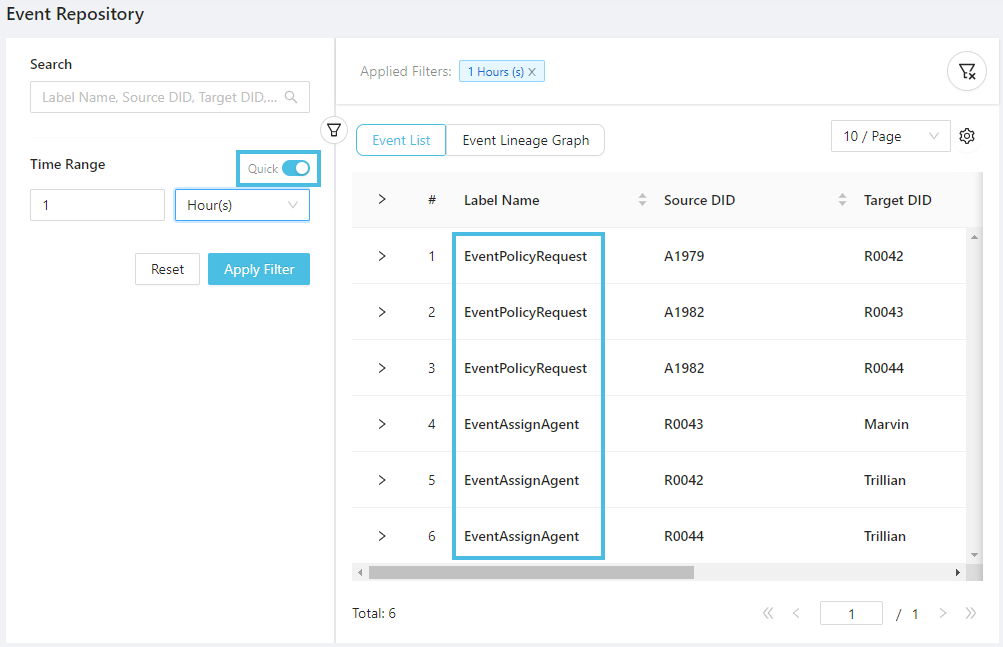
To filter events emitted from different tasks, we can use "Quick" mode to filter events within a specific time range:
After locating the six events we're looking for, we can switch to the data lineage graph (you'll need to drag the nodes around to your liking):
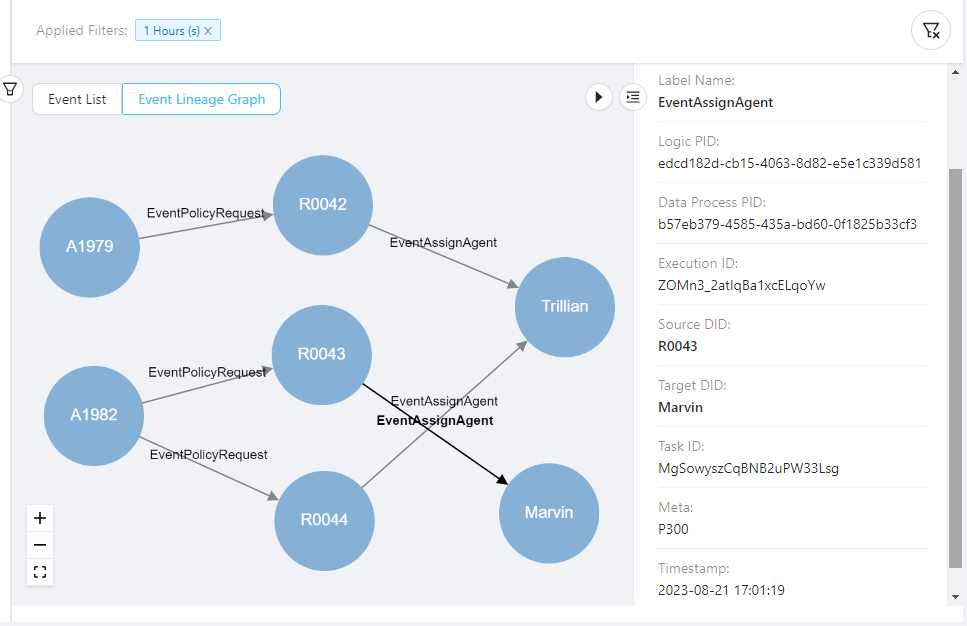
This clearly show the data flow of between the two data processes: the applicant first submited a request for a certain type of insurance policy, then each request got assigned to one agent (if there is one). This can go on across the whole business process and be used to find out incorrect business mappings or missing links.