Emit and Inspect Events
LOC data events allows users to generate a data flow or data trail to indicate who have sent and received data. These information can be very useful for two reasons:
- To coordinate actions across multiple data processes
- For auditing purpose
Here we will have a look at a simple example that use events and then inspect them in Studio.
This tutorial uses JavaScript.
Emit Events
Use Case: Insuance Policy Application
Imagine you are working for a insurance company and need to build a new process to let customers submit applications for new policies.
We assume the company offers the following policies:
| Policy Code | Type |
|---|---|
| P100 | Permanent life insurance |
| P200 | Health Insurance |
| P300 | Liability car insurance |
| P400 | Personal injury protection |
| P500 | Personal property coverage |
The system needs to record who submits an application to what policy? so that the company and the customer can track the processing progress:
The applicant ID will also stored as meta in the event for reference.
The request JSON payload (multiple applications) looks like this:
[
    {
        "requestID": "R0042",
        "policyCode": "P100",
        "applicantID": "A1979"
    },
    {
        "requestID": "R0043",
        "policyCode": "P300",
        "applicantID": "A1982"
    },
    {
        "requestID": "R0044",
        "policyCode": "P500",
        "applicantID": "A1992"
    }
]
So there will be 3 events:
R0042  ->  event_application  ->  P100
R0043  ->  event_application  ->  P300
R0044  ->  event_application  ->  P500
How to design events is an art: to make it simple, easy to query, yet capable enough to serve your business. It would be equally important as designing the data processes themselves.
Code Walkthrough
We will use two generic logic in this example:
| Logic | Purpose |
|---|---|
| Generic #1 | Read and parse payload |
| Generic #2 | Emit event_application events |
| Aggregator | Report how many events have been emitted |
async function run(ctx) {
    // read payload and parse to JSON
    const payload = JSON.parse(
        new TextDecoder().decode(new Uint8Array(ctx.payload.http.body)),
    );

    // generate event schema objects based on the payload
    let events = [];
    payload.forEach((item) => {
        events.push({
            labelName: "event_application",
            sourceDID: item.requestID,
            targetDID: item.policyCode,
            meta: item.applicantID,
            type: "default",
        });
    });

    // pass events to session
    await ctx.agents.sessionStorage.putJson("events", events);
}

async function handleError(ctx, error) {
    ctx.agents.logging.error(error.message);
}
async function run(ctx) {
    // read events from session
    const events = await ctx.agents.sessionStorage.get("events");

    // emit events
    await ctx.agents.eventStore.emit(events);

    // pass number of events to session
    await ctx.agents.sessionStorage.putString(
        "emittedNum",
        String(events.length),
    );
}

async function handleError(ctx, error) {
    ctx.agents.logging.error(error.message);
}
async function run(ctx) {
    // read the number of emitted events from session
    const emittedNum = await ctx.agents.sessionStorage.get("emittedNum");

    // finalise result with a message
    ctx.agents.result.finalize({
        status: "ok",
        taskId: ctx.task.taskId,
        result: `Emitted ${emittedNum} events`,
    });
}

async function handleError(ctx, error) {
    ctx.agents.result.finalize({
        status: "error",
        taskId: ctx.task.taskId,
        error: error.message,
    });
}
Invoke
In order to inspect the events in Studio, you'll need to deploy the data process above to LOC (not local runtime).
You can invoke it with either an API route or single data process execution (see QUick Start.)
The finalised result would be like
{
    "status": "ok",
    "taskId": {
        "executionId": "...",
        "id": "..."
    },
    "result": "Emitted 3 events"
}
Inspect Events
Using Data Discovery
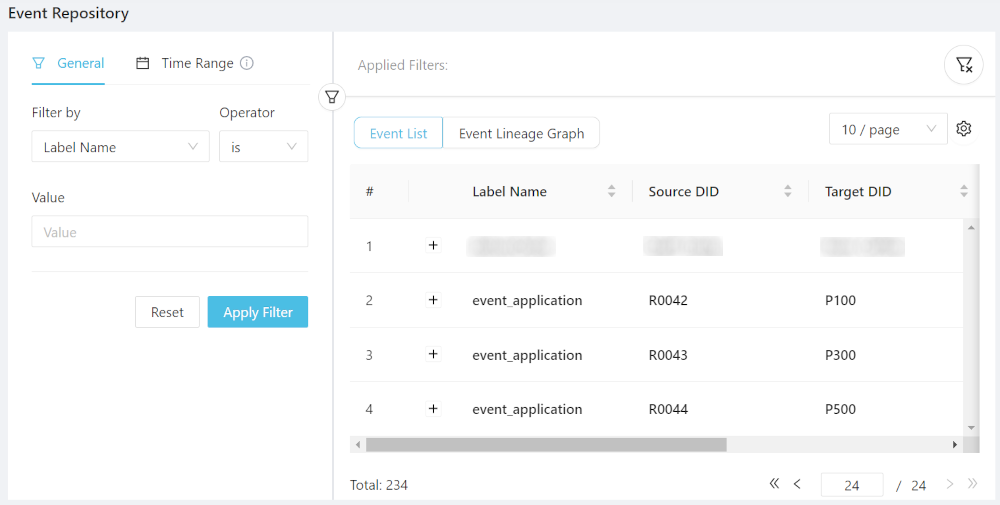
Now go to Data Discovery in Studio and click Events. Scroll the event browser to the latest ones, and you should see the event_application events:
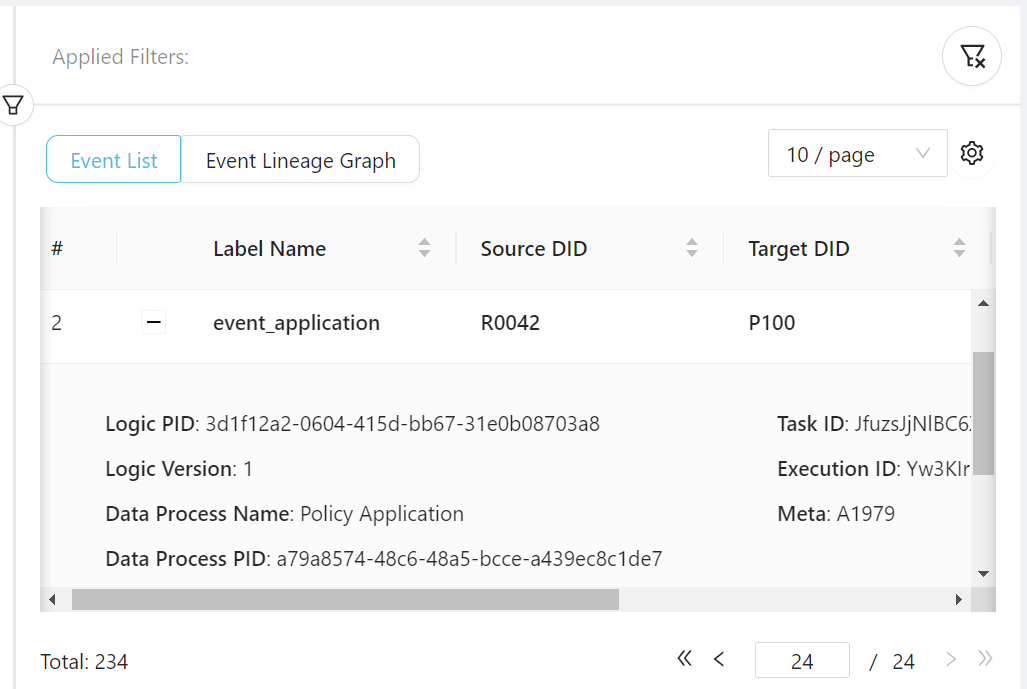
If you click the littke "+" mark in front of an event, you can inspect its details (including the meta payload, which contains the applicant ID):
Data Lineage Graph
There's another thing you can do in Data Discovery, that is data lineage graph.
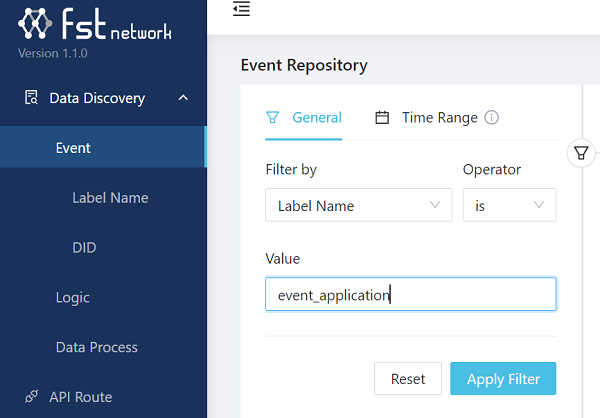
Since there may be many other events in your LOC environment, we first need to filter out event_application:
Click Apply Filter then click Event Lineage Graph on the right side.
The graph may be tangled together at first, but you can drag the blue dots around and zoom in/zoom out:
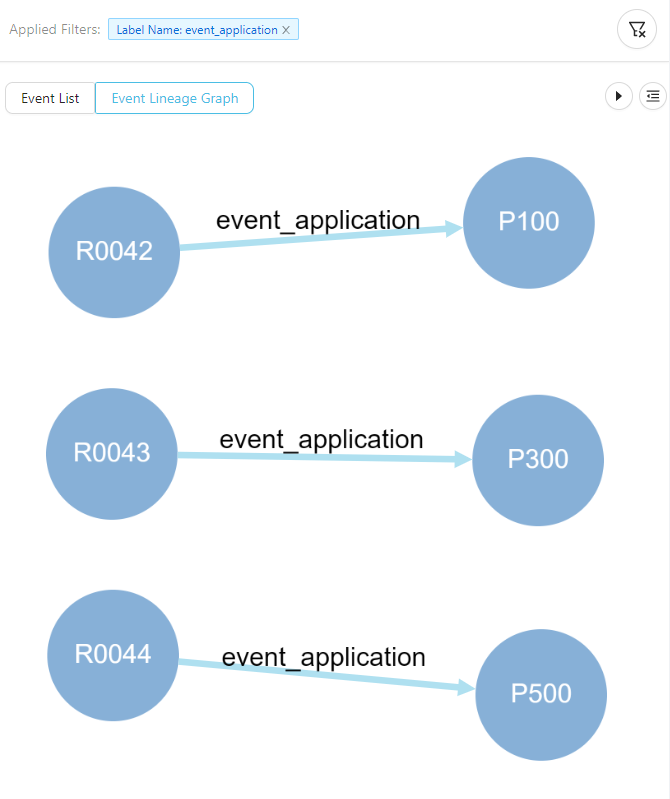
You can clearly see that this is the graphical representation of an event - request R0042 sent an application to policy P100, and so on. Both R0042 and P100 have became nodes - a digital or virtual identity as a data sender or receiver.
In the next article, we will see that we can extend this data flow even further - creating a longer data trail as the application get processed.